Cardiopro

CardioPro Infiniti is a specialized off-line analysis module which brings advanced heart rate variability (HRV) analysis capabilities to the BioGraph Infiniti platform. It complements any physiological biofeedback suite (such as the Physiology suite) by providing sophisticated data analysis methods that were only previously available in very specialized software packages such as Thought Technology's CardioPro software.
Easy access to BioGraph sessions
The module accesses BioGraph Infiniti's client database directly and is capable of processing open display and script sessions that were recorded with either an electrocardiograph (EKG) or blood volume pulse (BVP) sensor to generate session specific statistical analysis. (The module is also compatible with Thought Technology's specialized receiver for the T31 Transmitter belts# from Polar™.)
Easy normalizing of IBI data
The module provides advanced tools for normalizing and analysing inter-beat interval (IBI) data. The statistical analyses follow the guidelines published in 1996 by the HRV Task Force. A powerful IBI editor offers both automatic and manual normalization functions to help you rapidly remove artifacts caused by extra beats, missed beats or premature atrial/ventricular contractions (PAC or PVC) using three standard operations, ADD, SPLIT and AVERAGE.


Easy analysis of peripheral physiological data
The module also provides all the editing and statistical analysis functions you need for removing artifacts from other physiological measures such as respiration, skin conductance, temperature and electromyography (EMG).

Easy reporting options
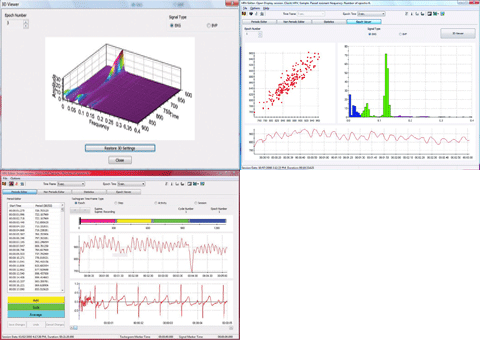
Once recorded data is normalized and artifacts have been rejected, the module generates a thorough statistical analysis which you can review, prior to printing it out. The module's ability to reprocess your data with epoch durations of either 1, 3, 5 or 10 minutes adds unmatched flexibility to your analysis. The graphical analysis also provides epoch by epoch 2D and 3D power spectrum views as well as a standard tachogram and Poincaré plot. Once you are satisfied with the data analysis, you can rapidly generate reports as either Microsoft Word or Excel documents and export IBI data and statistical tables to text files.


